Sample report
This is a real one.
A single-family home in Seminole County. Every number below is from the Seminole County property appraiser's file as of 2026-09-05. The owner's home stays anonymous; the comparable sales are shown as the county recorded them.
Recent closed sales that compare
| Sold | Address | Subdivision | Price | Sqft | $/sqft | vs $214 | Bd/Ba | Built | Deed |
|---|---|---|---|---|---|---|---|---|---|
| 2026-08-18 | 4667 Redmond Pl | Oregon Trace | $445,000 | 2,042 | $218 | ▲ +$4 | 3/2 | 2003 | Warranty Deed |
| 2026-08-07 | 257 Venetian Bay Cir | Venetian Bay | $445,000 | 1,974 | $225 | ▲ +$11 | 4/2 | 2004 | Warranty Deed |
| 2026-08-05 | 1469 Stargazer Ter | Retreat At Wekiva | $490,000 | 2,268 | $216 | ▲ +$2 | 4/3 | 2002 | Warranty Deed |
| 2026-07-29 | 304 Still Forest Ter | Tall Trees | $710,000 | 2,746 | $259 | ▲ +$45 | 5/3 | 1994 | Warranty Deed |
| 2026-07-29 | 4750 Cains Wren Trl | Preserve At Astor Farms | $597,000 | 2,376 | $251 | ▲ +$37 | 3/3 | 2003 | Warranty Deed |
| 2026-07-23 | 4771 Cains Wren Trl | Preserve At Astor Farms | $578,000 | 2,833 | $204 | ▼ −$10 | 4/3 | 2003 | Warranty Deed |
| 2026-07-16 | 209 Porchester Dr | Kays Landing | $575,000 | 2,533 | $227 | ▲ +$13 | 5/3 | 2005 | Warranty Deed |
| 2026-07-10 | 1834 Stargazer Ter | Retreat At Wekiva | $485,000 | 2,296 | $211 | ▼ −$3 | 3/3 | 2004 | Warranty Deed |
| 2026-07-10 | 4903 Fawn Ridge Pl | Lake Forest | $575,000 | 2,334 | $246 | ▲ +$32 | 4/3 | 2001 | Warranty Deed |
| 2026-07-09 | 312 Kimberly Ct | Shadow Lake Woods | $510,000 | 2,597 | $196 | ▼ −$18 | 4/3 | 1985 | Warranty Deed |
| 2026-07-06 | 110 Calabria Springs Cv | Calabria Cove | $535,000 | 2,556 | $209 | ▼ −$5 | 5/3.5 | 2002 | Warranty Deed |
| 2026-06-18 | 111 Carmel Bay Dr | Monterey Oaks | $495,000 | 2,170 | $228 | ▲ +$14 | 3/2.5 | 2001 | Warranty Deed |
vs $214 — each sale's $/sqft against the owner's basis; ▲ above, ▼ below. Other rows match the comp bands: single-family, 3–5 bd / 2–4 ba, ≈1,900–2,900 sqft, built ≈1985–2010. Nominal, multi-parcel, quitclaim, tax and certificate-of-title deeds are filtered out. Source: Seminole County CAMA.
Average $/sqft by close month, with trend
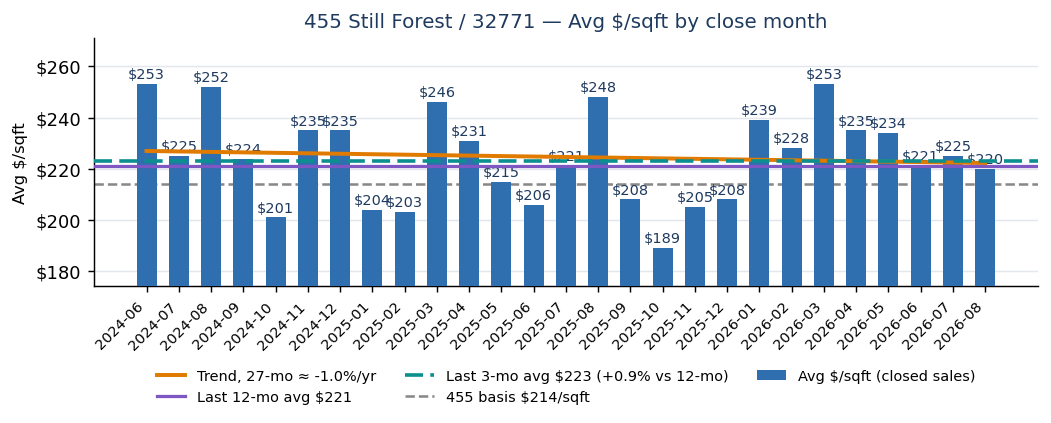
| Month (close) | Sales | Avg $/sqft | vs basis | MoM Δ |
|---|---|---|---|---|
| 2026-03 | 4 | $253 | ▲ +$39 | ▲ +$25 |
| 2026-04 | 3 | $235 | ▲ +$21 | ▼ −$18 |
| 2026-05 | 6 | $234 | ▲ +$20 | ▼ −$1 |
| 2026-06 | 7 | $221 | ▲ +$7 | ▼ −$13 |
| 2026-07 | 8 | $225 | ▲ +$11 | ▲ +$4 |
| 2026-08 | 3 | $220 | ▲ +$6 | ▼ −$5 |
Analysis
One new sale cleared the comp bands this week: 4667 Redmond Pl in Oregon Trace at $445,000, $218/sqft — $4 above your basis, on a smaller 3/2 house. The top recent comp is still the July sale at $710,000 ($259/sqft) on a larger 5/3; it continues to anchor the top of the range, but a single sale is not a trend.
Month over month, August averaged $220/sqft on three sales, down $5 from July and $6 above your $214 basis. The trailing three months ($223, n=18) sit +0.9% over the trailing twelve ($221, n=53) — recent sales are running at the baseline, not above it. The full 27-month trend line annualizes to −1.0%/yr: flat. Nothing in this week's record argues for listing now; the report will flag the week the 3-month average breaks meaningfully above the 12-month line.
Figures are deterministic county data. The analysis paragraphs are drafted from those figures and may not introduce any number that isn't in the tables. Report generated 2026-09-05.